
Opioid Deaths By Region
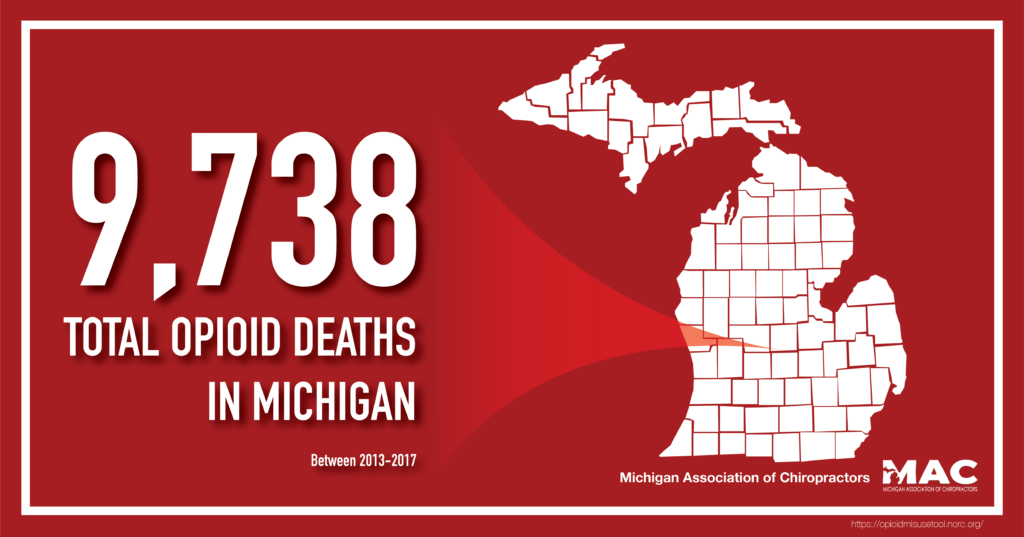
Entire State
Facebook
Twitter
LinkedIn
Pinterest
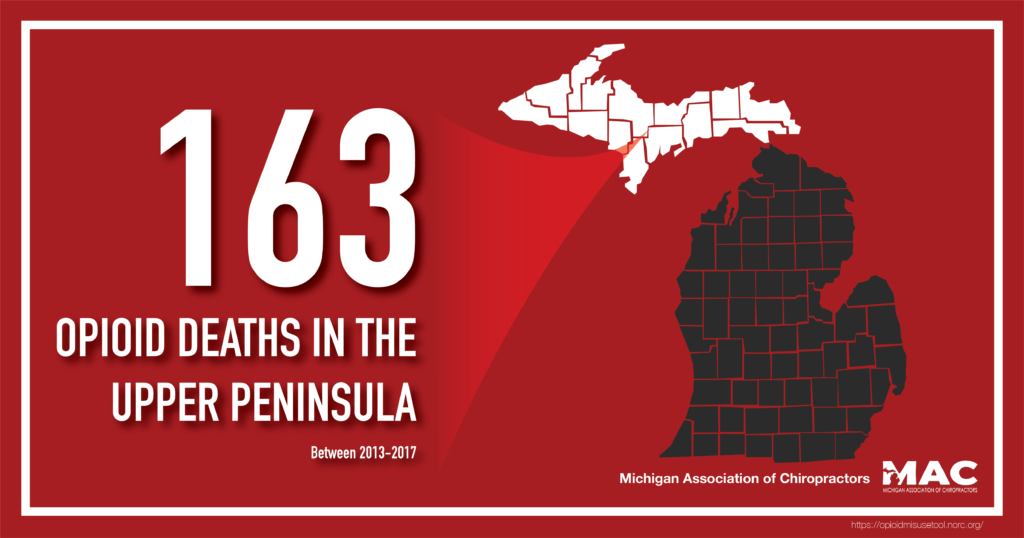
Upper Peninsula
Facebook
Twitter
LinkedIn
Pinterest
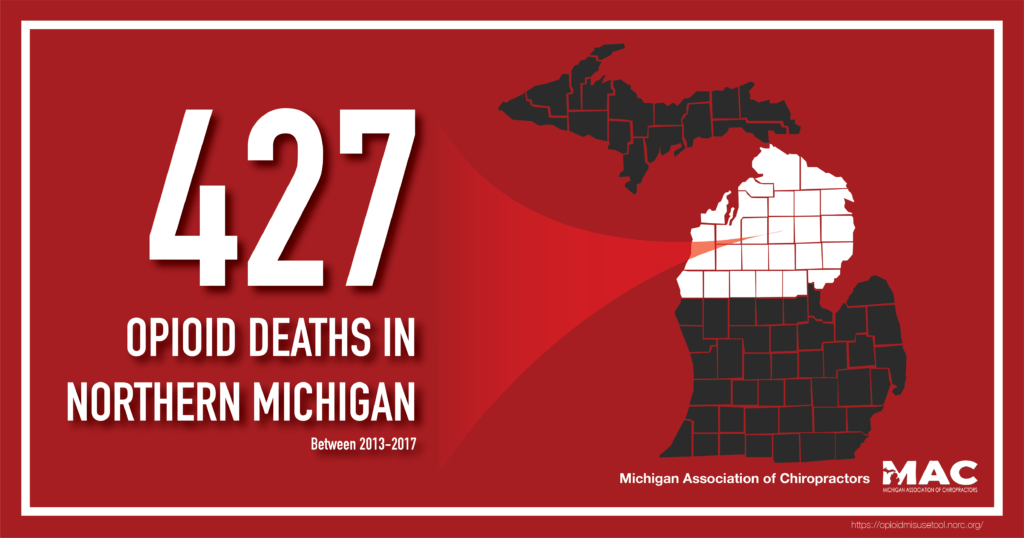
Northern Michigan
Facebook
Twitter
LinkedIn
Pinterest
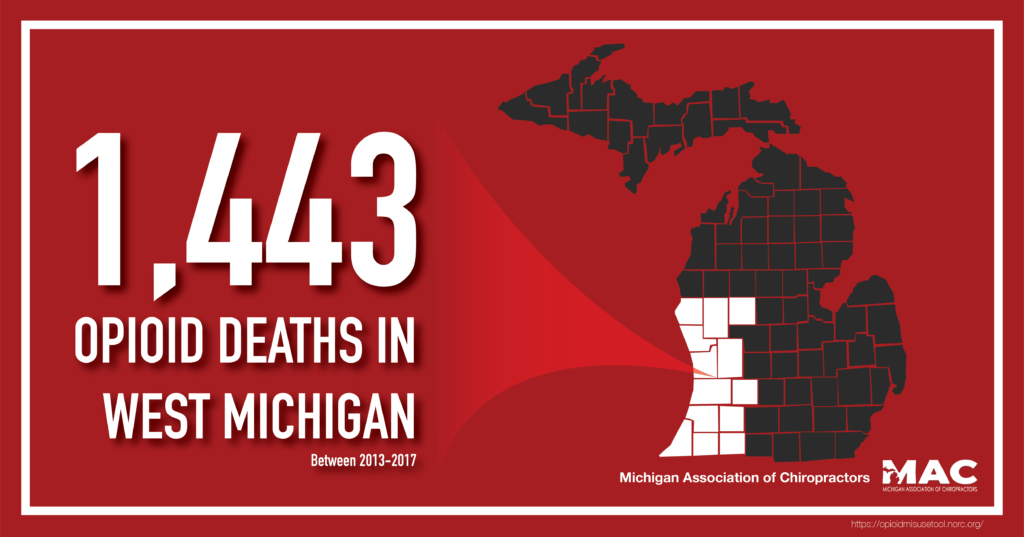
West Michigan
Facebook
Twitter
LinkedIn
Pinterest
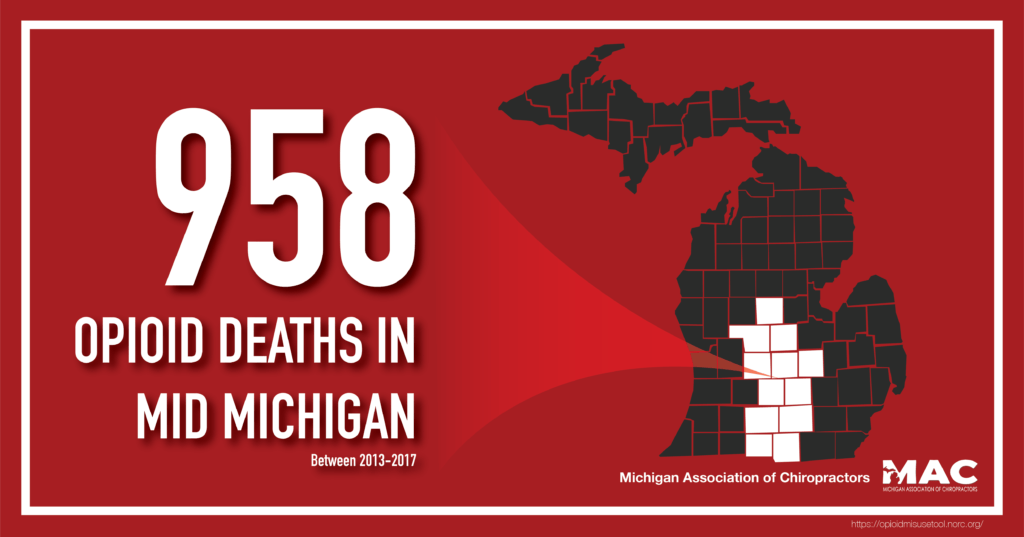
Mid Michigan
Facebook
Twitter
LinkedIn
Pinterest
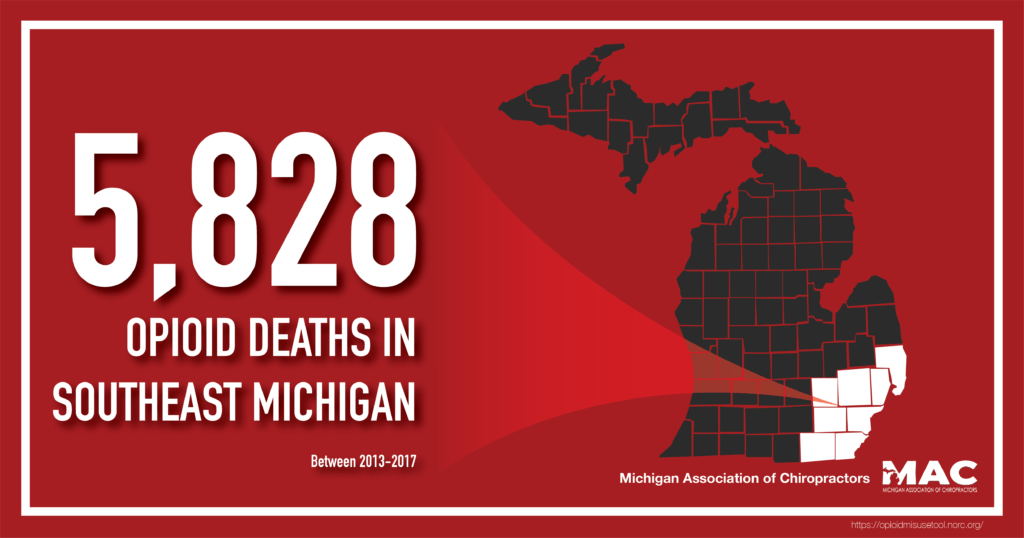
Southeast Michigan
Facebook
Twitter
LinkedIn
Pinterest
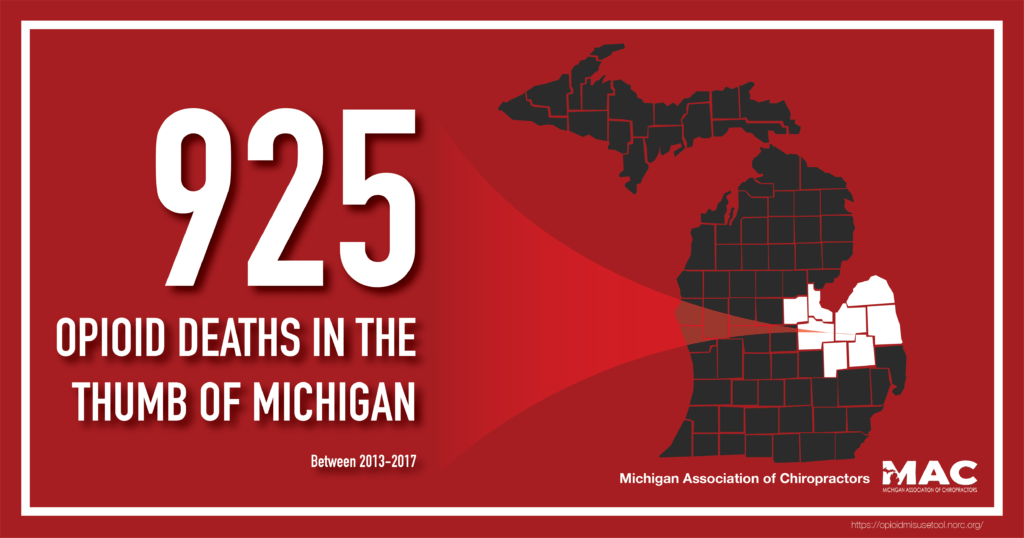
Thumb of Michigan
Facebook
Twitter
LinkedIn
Pinterest